


The industrial revolution has driven the way that our transportation, economy, and environment is today. In the process, it disconnected people. We need to drastically shift how we grow as a province, seeing people as an active part of the health of the environment.
When designing for the automobile, development spread in places that it should not, invading the natural landscape. LWT lines will protect the natural environment by placing them in areas best suited for growth.
LWT leads to less impact on the environment, less pollution, and greenhouse gases, and preserves natural land
Public transportation produces 95 percent less carbon monoxide (CO), 90 percent less in volatile organic compounds (VOCs), and about half as much carbon dioxide (CO2) and nitrogen oxide (NOx), per passenger mile, as private vehicles.
Transportation is the largest sector for energy demand at 44% (Government of Canada, 2019)
One-fifth of all emissions in the US is from automobile use (Union of Concerned Scientists, 2014)
24 pounds of carbon dioxide for every gallon of gas (largely comprised of carbon, once gasoline burns, the carbon releases and combines with oxygen from the air to form CO2.) • In 2010, NASA declared that autos were officially the largest contributor to climate change pollution globally (NASA, 2010)
Transportation is the second-largest contributor to carbon dioxide emissions at 24% (the largest is the oil and gas by sector at 27%) (Government of Canada, 2020a).
The increase in total GHG emissions between 1990 and 2017 was mostly due to an 84% increase in emissions in the oil and gas sector and a 43% increase in the transportation sector (Government of Canada, 2020a).
A bus with as few as seven passengers is more fuel-efficient than the average single-occupant auto used for commuting (State of Delaware).
Transit, reduces levels of traffic noise pollution. Exposure to
excessive noise levels can induce hearing loss and negatively impact mental health. • Of the five categories that were identified as sources of heavy metals (air pollution, automotive, industrial, residential, and water supply), automotive sources were among the most significant sources of heavy metals, including vehicle exhaust, tire wear, and brake pad wear (Armstrong, 1994).


There are costs to driving cars—one of which is our health. People make healthier choices when transit is the first and best choice for getting around. In other words, transit needs to be frequent, efficient, reliable, and accessible to bring people closer to food, housing, healthcare and employment opportunities while helping youth and older adults to engage in healthy activities.
“Our built environment can kill us in at least three different ways: obesity, asthma, and car crashes” (adopted from a walkability study report by Speck and Associates). Transit positively contributes to combat all that.
33% of adults 18 years and over are obese in NS (Government of Canada, 2020b)
12% of people 12 years and over in 2018 had diabetes in NS (Government of Canada, 2020b)
17% of people 12 years and over in 2018 reported being quite a bit or extremely stressed most days in NS (Government of Canada, 2020b)
Lower rates of respiratory and heart disease. Transit allows for more space on the street for active transportation. Getting active helps lower the risk for many serious diseases, such as: heart and vascular diseases, strokes, diabetes, hypertensive diseases, osteoporosis, joint and back problems, colon and breast cancers, and depression.
Lower accident rates. Better transit means less cars on the road. According to a 2006 report, public transit has 0.03 fatal accidents per 100 million miles-about 1/25th the rate for automobiles; injuries as well as fatalities are reduced (Injury Facts, report, 2006).
Quality of life. One-third of American children born after 2000 will become diabetics (U.S. Centers for Disease Control). For the first time in history, the current generation of youth are expected to live shorter lives than their parents. This is due partly to diet, but partly to planning. Public transportation fosters a more active lifestyle. Data for transit users finds that walking to and from transit helps people attain a significant portion of their recommended minimum daily exercise; 29% of respondents get 30 minutes or more of exercise a day from walking to or from transit (2001 National Household Travel Survey).
Provides Critical Support During Emergencies and Disasters. Public transportation an important back-up for moving people quickly during a disaster or emergency. Transit provides air-conditioned shelters for victims, responders and rescue equipment.
Delivers essential health and human services and provides important options for health care delivery. The availability of public transportation helps agencies provides an afforadable option compared to the costly use of ambulance and emergency services, and helps relieve parking pressures from patients, staff and visiotrs.
Public transportation provides access to essential services later in life. Public transportation is a way for these non-drivers (particularly low-income seniors and disabled individuals) to gain access to important services and activities that improve public health such as: healthcare appointments, basic shopping, banking, education, and employment opportunities.
Public transportation reduces stress and improves one’s quality of life and household finances. Public transportation improves access to education and employment, which in turn leads to better long-term economic opportunities. It also provides access to social and recreational activities, allowing individuals to participate in events they otherwise couldn’t. Furthermore, public transit benefits community cohesion by promoting positive interactions between neighbors. When combined with saving on private automobile expenses, leaves more money to access healthier choices for food and lifestyles.


Transit is a fundamental public service, one that we should all have the opportunity to benefit from, regardless of age, race, income level, and mobility needs. A robust transit system has the ability and is the key ingredient to improving the quality of life for all Nova Scotian’s, arguably it could be considered a civil right.
Transit needs to be accessible and effective not just in the urban core, but in suburban and rural areas across the province. The current transit system is unreliable, infrequent, unaffordable or non-existent for most people and parts of Nova Scotia. Low-income, disadvantaged, marginalized communities are especially disconnected and effected by the lack of good public transit. Transit increases youth retention and allows for older people to age in place with dignity.
Transit has significant and diverse equity impacts:
Access to employment opportunities Access to quality education
Access to health care services
Access to healthy and affordable food
Access to economic, social and recreational opportunities
Affect development location, type and land value, and therefore housing accessibility and affordability
Public Transit directly impacts all of the United Nations Sustainable Development Goals, which are considered “the blueprint to achieve a better and more sustainable future for all” (United Nations, 2020). Seven of these goals shown here directly effect equity. LWT will work with each region of Nova Scotia to build transportation system designed for all ages and abilities that connects urban, rural, and suburban areas across Nova Scotia.


Public transit contributes to our economic health at different scales. Our individual and collective economic futures depend on where and how we grow as a province and the opportunities we have access to. Leading with transit will allow us to protect Nova Scotia’s landscape and heritage while connecting rural, suburban, and urban communities.
The Economic Impact of Transit Investment: A National Survey (2010) commissioned by the Canadian Urban Transit Association, took a holistic look at the diverse economic impacts of Canada’s investment in transit facilities and services. Below are just a few key points that reflect how Transit drastically impacts our economy at the National, Provincial, and Local Community scales as well as our Health Care system, Households, and at an individual level.
The Canadian transit industry generates jobs, income and wealth for the country’s economy. Capital intensive transit systems generate employment in construction, professional services, research and development
The economic benefit of Canada’s existing transit systems is at least $10 billion annually.
Public transit encourages more compact development, enabling the better use of scarce resources; land, energy and financial capital.
Transit also improves access to the labour pool for employers in large and small communities alike.
The transit industry directly employs 45,300 Canadians and indirectly creates an additional 24,300 jobs.
Transit reduces annual greenhouse gas emissions by 2.4 million tonnes, valued at $110 million.
Transit saves about $115 million in annual health care costs related to respiratory illness, by mitigating the impacts of poor air quality on the health of individuals.
Transit reduces the economic costs related to health care and lost productivity of traffic collisions by almost $2.5 billion annually.
Transit reduces vehicle operating costs for Canadian households by about $5 billion annually.
Public transit is an important transportation option for the majority of Canadians who live in urban areas.
For people without access to personal motor vehicles, transit provides a way to get to work, school, recreation, shopping and personal services.
Commuting by transit is a third to half as expensive as commuting by car
Taking transit can give a substantial boost to a family’s disposable income.
Transit passengers save money by not having to operate an automobile. Transit is also safer than automobile use and reduces death, injury and property damage suffered due to traffic collisions.
Transit customers save time by avoiding congested roads, and other road users also benefit from reduced congestion.

Transit can influence and direct where and how growth occurs. Transit routes need to reflect where ridership and development should be—not just where existing ridership and development is. Currently our development lacks direction and our transit networks plays catch up to where people are living, resulting in a high use of cars. Instead, we need to adopt a form of Transit-Supportive Development or Transit-Oriented Development that goes beyond by embracing a Light Rail Transit Skeleton for the province and within HRM.
LWT would use an elevated form of TSD and TOD. It both recognizes current growth and anticipates future growth to create a vision for future development in our communities and province. The reality is that Nova Scotia has a growing population, with HRM seeing the largest growth at 2.26% in 2019. Our growth poses many challenges, but it also presents a strategic opportunity for our municipalities and province to harness this growth and development through investing in a robust transit system which will help us carve the path of where we develop.
“Transit-supportive development (TSD) is a broad principle that describes a relationship between urban growth and transit. By directing urban growth to areas that are already well-served by transit.”
“Transit-oriented development (TOD) is an approach to development with a more specific definition. In Ontario,TOD is defined as a strategy for development within an 800-metre radius of major transit stations, with the highest intensity and mix of land uses concentrated within 400 metres of a major transit station.”
Evergreen - How to create vibrant transit supportive communities: A Typology & Evaluation Tool
Our province is designed around the automobile, which is rapidly becoming a trend of the past. Europe and Asia are moving forward, and it is time that we did too. The well-known Copenhagen “Finger Plan” is a successful planning intervention.
Urban development is contained within the “fingers” aligned with commuter Rail lines that extend outwards from the urban core (palm).
Green and natural areas between the fingers are preserved, and efficient transit routes are provided along developed areas.
It allows for both urban growth and ecological protection to exist in the same strategy.
Copenhagen is a excellent example of a hybrid transit strategy (cycling, buses, water-buses, metro and s trains).


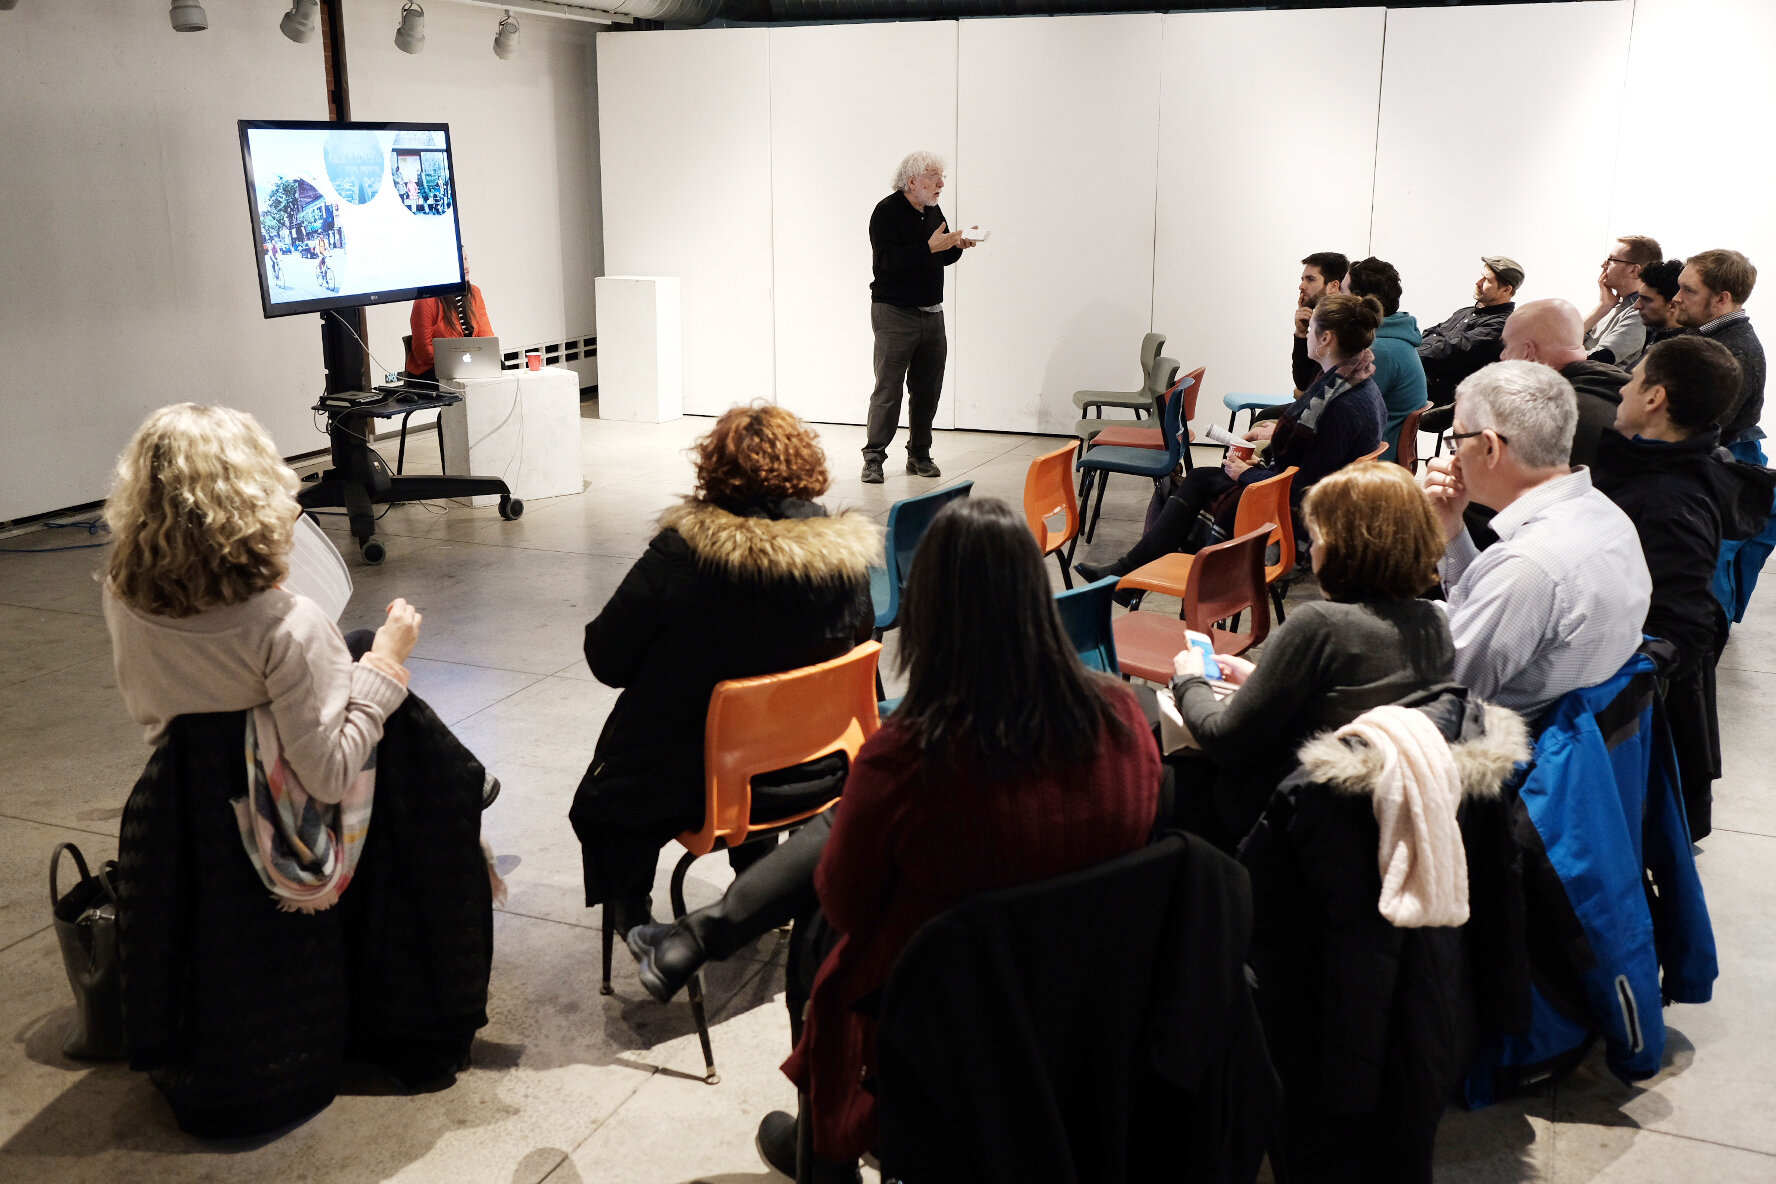
Engagement is at the core of this initiative. This project MUST come from the community to truly reflect our local and provincial needs are as Nova Scotian’s.
Already, a broad cross section of the community members have participated and worked on making Leading with Transit a reality, including rural and residents, young and old.
LWT’s public engagement events have provided a depth of community involvement and support. Each engagement session has helped develop the idea. Visit out website to read more on what we heard and gathered from these many meetings, conversations and workshops.
Working groups met biweekly between January and October of 2019. These work sessions were open to the community and made progress in all “Aspect” areas to get the project off the ground.
2019 public engagements:
Bridgewater – Nov 29
Sheet Harbour – Nov 27
Truro – Nov 26
Musquodoboit – Nov 25
Halifax – Nov 8
Dartmouth – August 25
Cobequid Community Health Board – July 19
Cobequid Community Health Board – July 4
Halifax – Jan 14
-Biweekly working group sessions – Jan-May (frequent participants included Jennifer Boyter, Ivy Ho, Scott Edgar, Phil Elliott, Ben Hammer, Jennifer Getz, Frank Palermo, and Kieran Stepan)
2018 public engagements:
Public Forum in Dartmouth – Nov
Public Forum in Halifax – Nov
Halifax – Nov 29
Dartmouth – Nov 27
Cole Harbour – Nov 25
HRM – Sept 6
HRM – Aug 9, 23, 30
HRM – July 5, 12, 26
HRM – June 18, 28
Halifax – May 1
Sackville – April 26
Spryfield – April 16
Dartmouth – April 11
BOMA (aligned with GIRT Plan)
YMCA – Peter Doigt
Mayor, Deputy Mayor, Councilors, MP Andy Filmore
Various Provincial Departments related to transportation and economic development (organized by Gordon Smith, Director of Planning)
Developers Danny Chedra, Loui Lowen (with Dexel), and Wadiah Faris
Presentations at the Art of City Building, Engage NS’s Quality of Life survey, Shift
Switch Car Free / Open Street Sundays
Transport Standing Committee Presentation – May 23
Cobequid Health District tour and 2 meetings with the board
Engage NS – when launching their survey frank talked about LWT
BOMA meeting—mention the plan that they put together (GIRT plan) and how we tried to line ours up with theirs
Continuous service, maximum 5-10 minute wait times
Dependable at all hours
Safe environments - on vehicles and at all stops and terminals
Separate transit right-of-ways
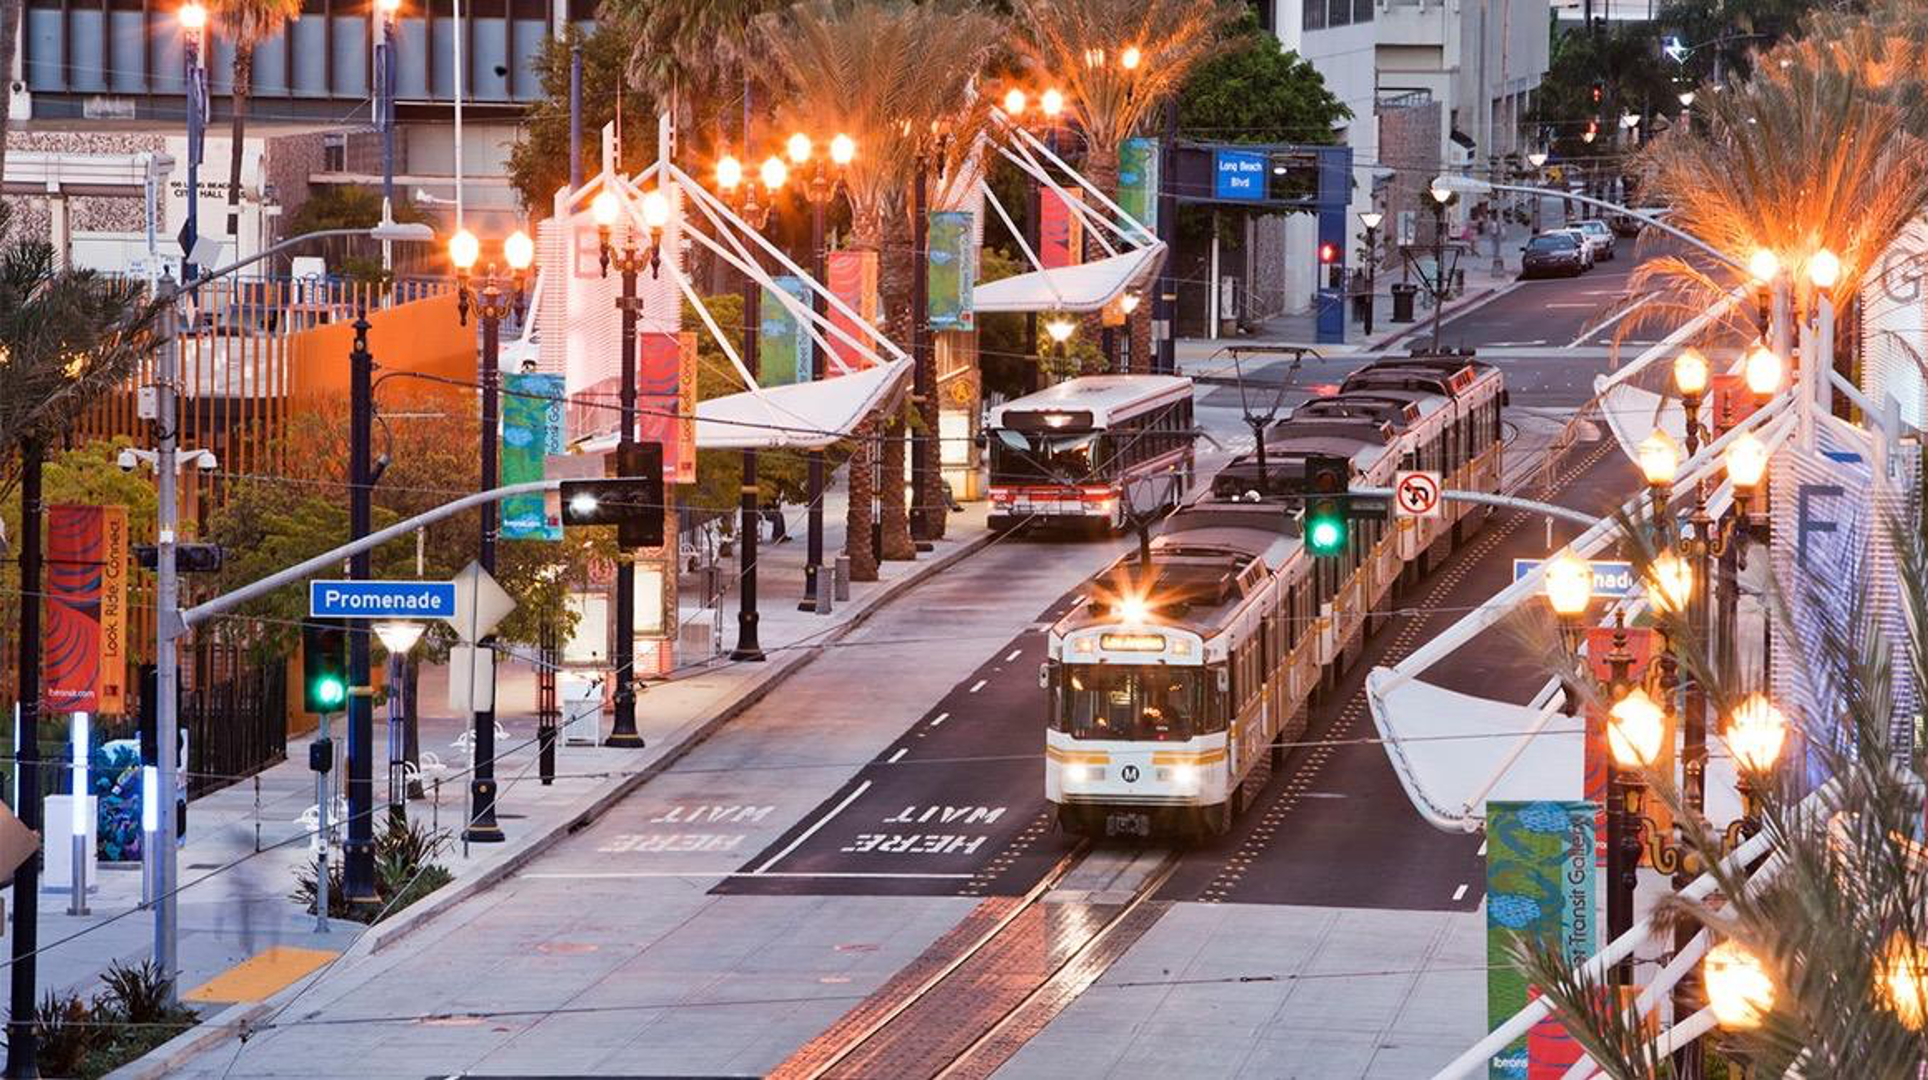
Seamless connectivity between modes and routes
Connectivity: linking communities with places of work, education, and recreation
Environmental and energy efficiency
Faster and easier than private vehicles
Long-term investment that will shape development of our city and province
Routes will not change
Permanent transit defines growth
Integration of transit with development and environment
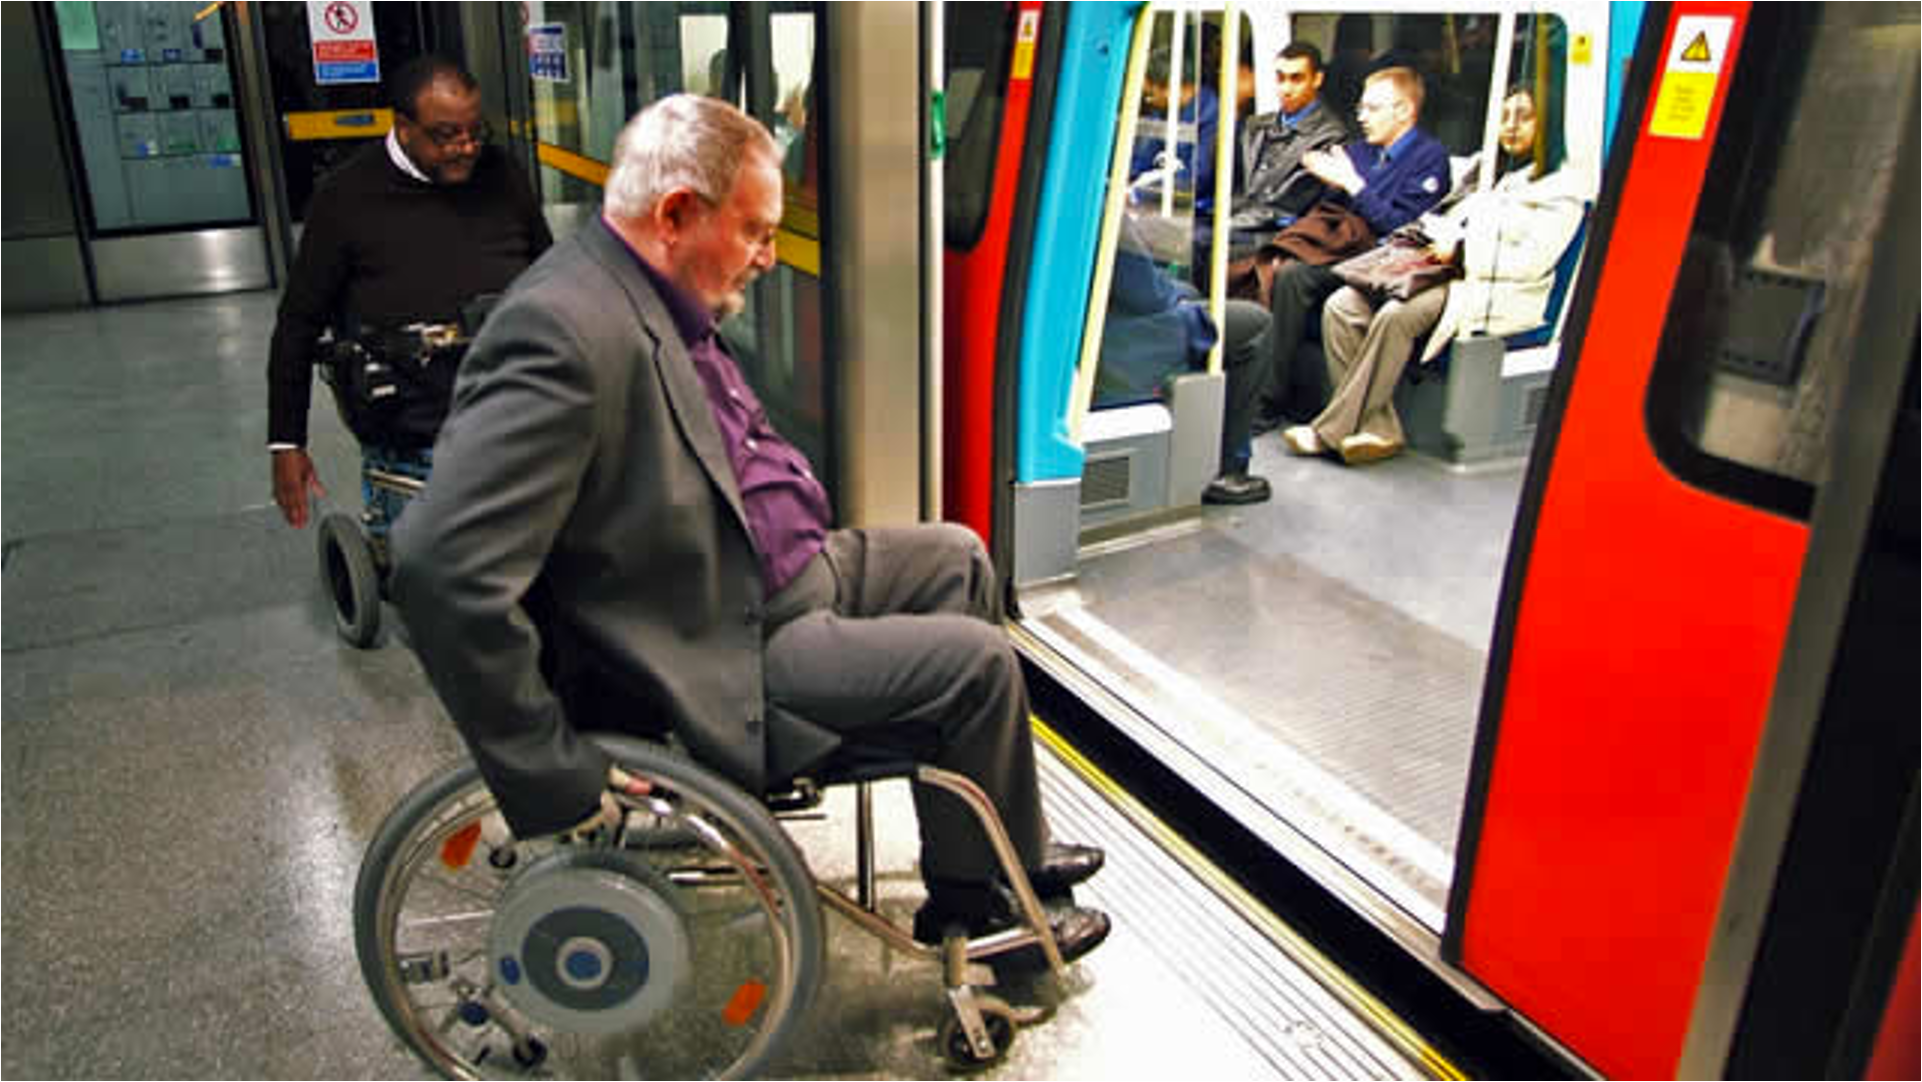
Accessible for all abilities
Equitable and affordable fare structure
Maximum 500m access to transit
Intuitive, simple, easy to navigate
Identifiable routes and stops
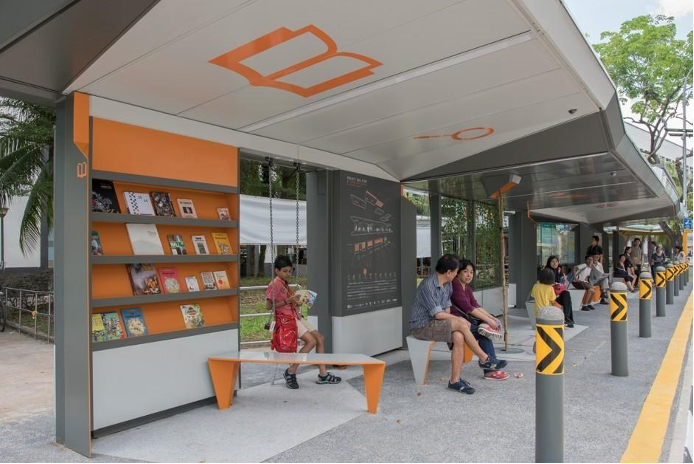
As much or more comfort than a private vehicle
Weather protection, good lighting, Wifi, seating, food and coffee
Space to accommodate bikes, groceries, or luggage
Honour neighbourhood culture and heritage through signage, public art, and design
Create identifiable transit stops with unique identities
Tie communities together, rather than splitting them apart
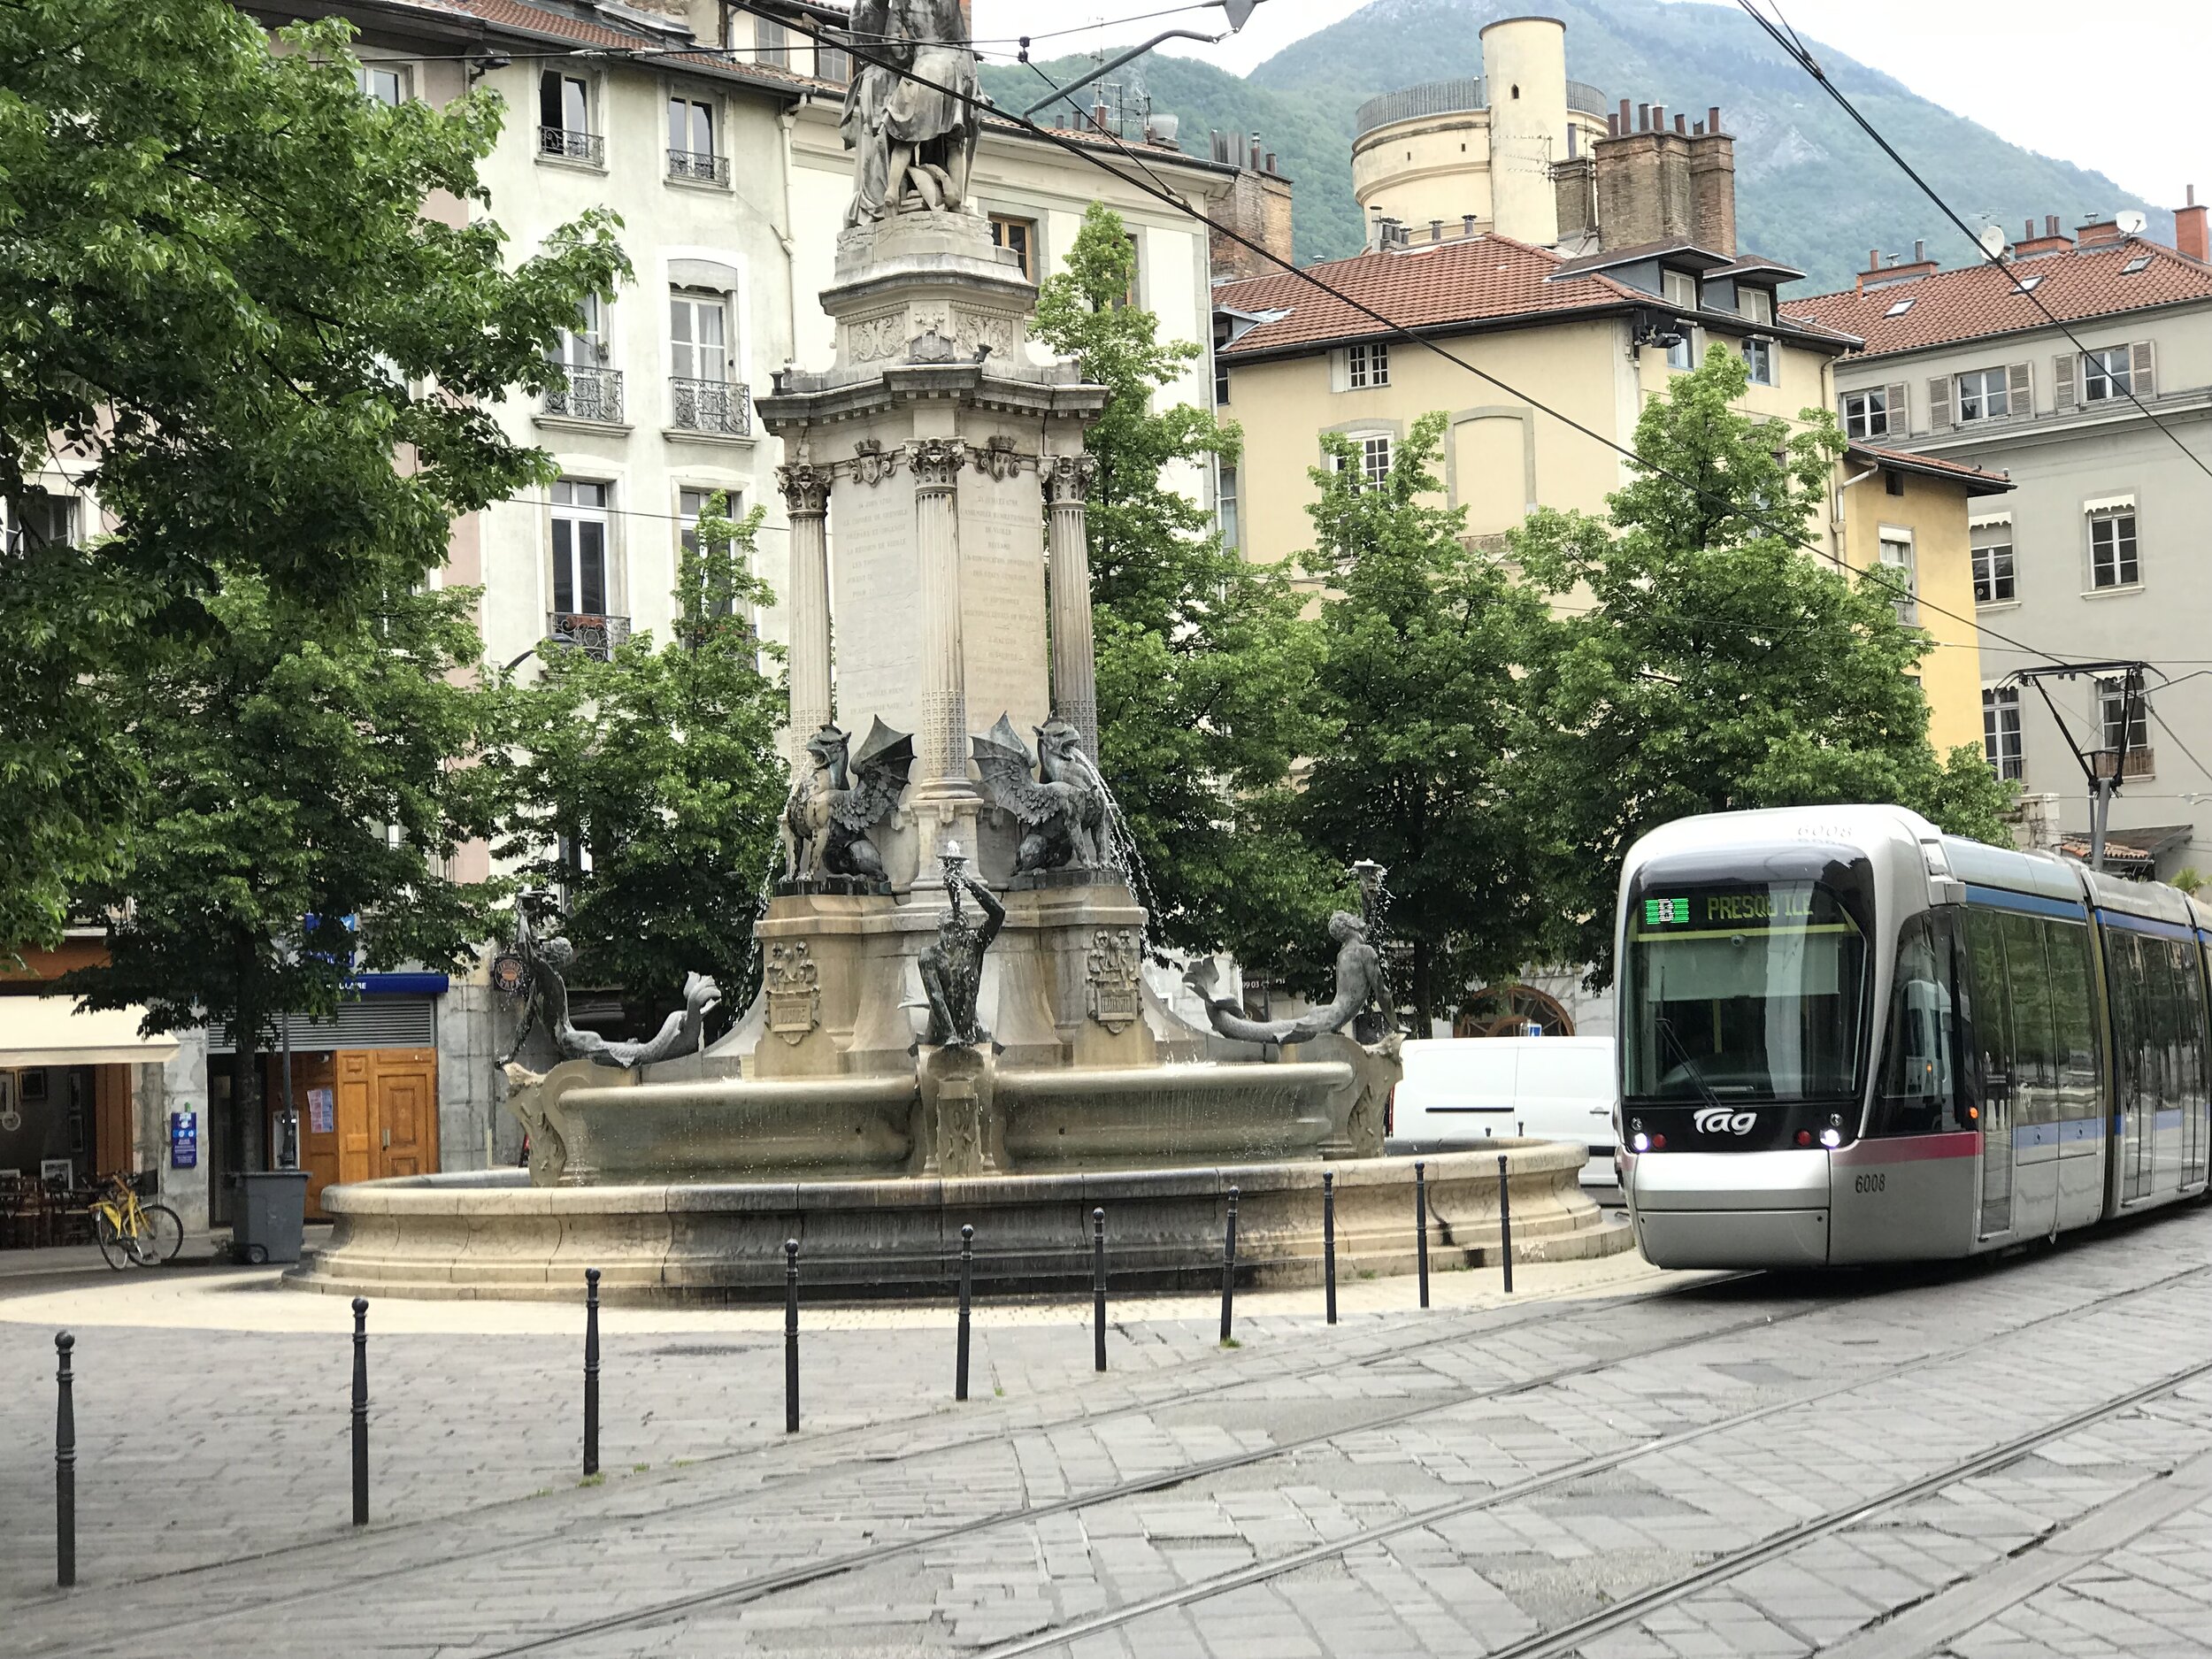
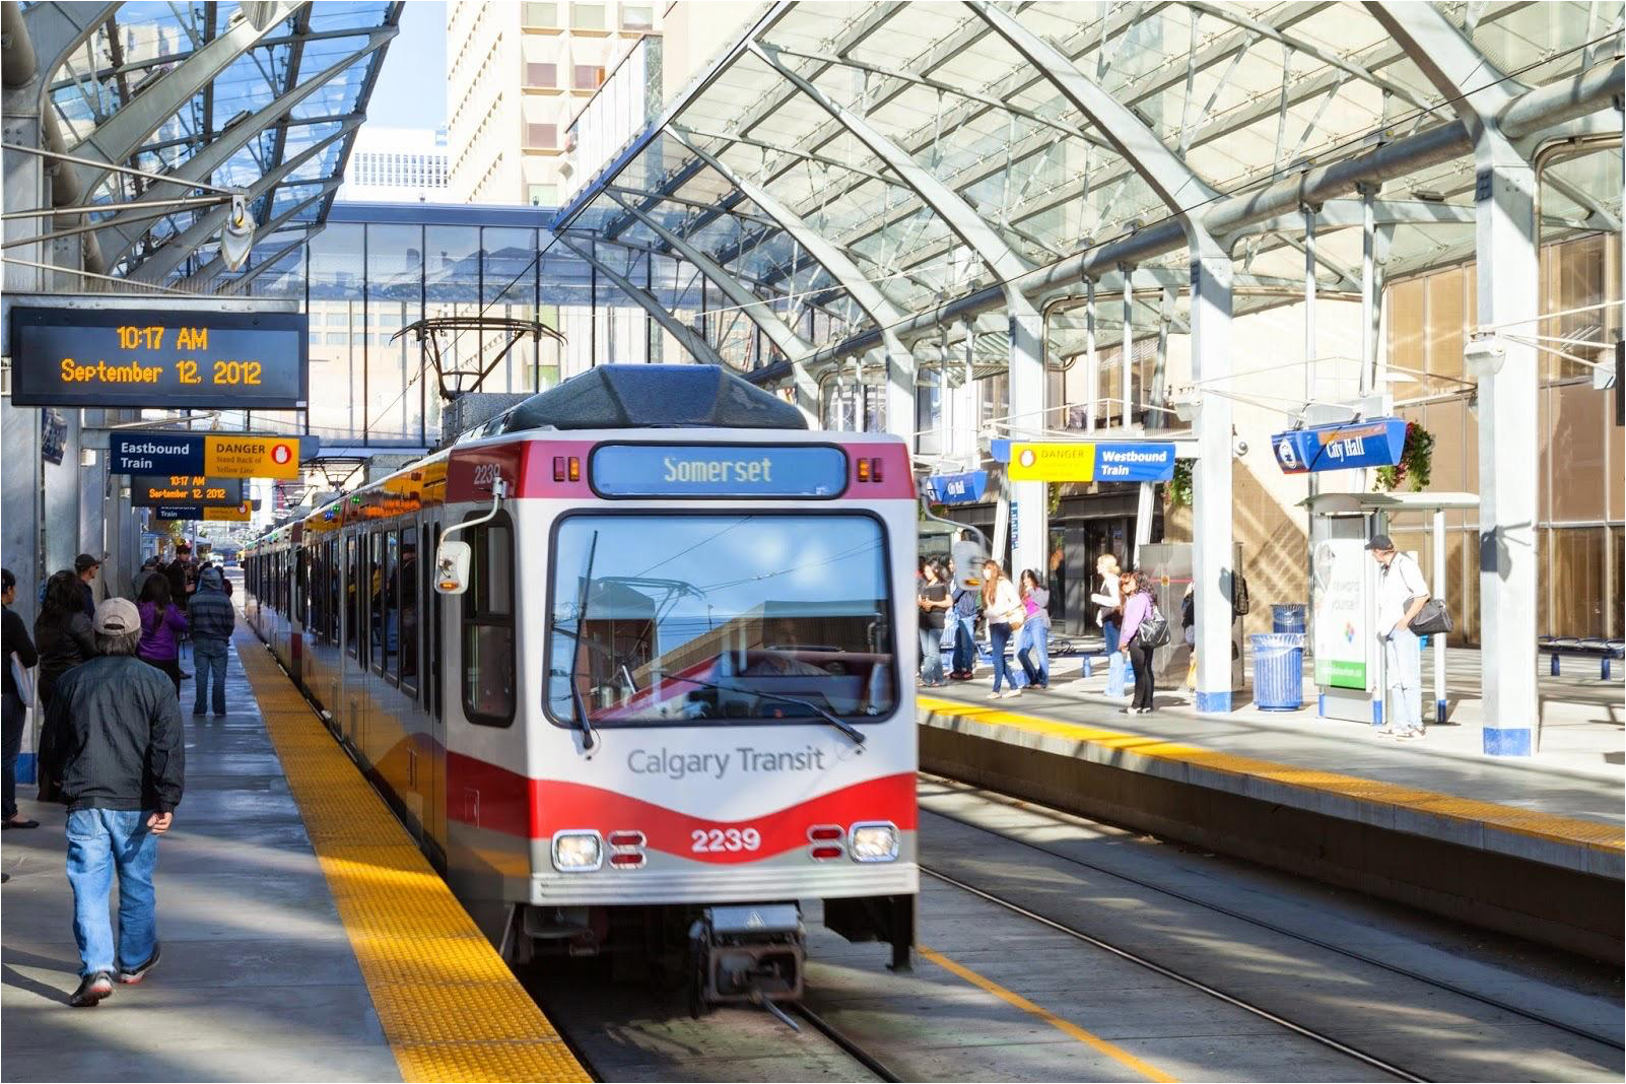
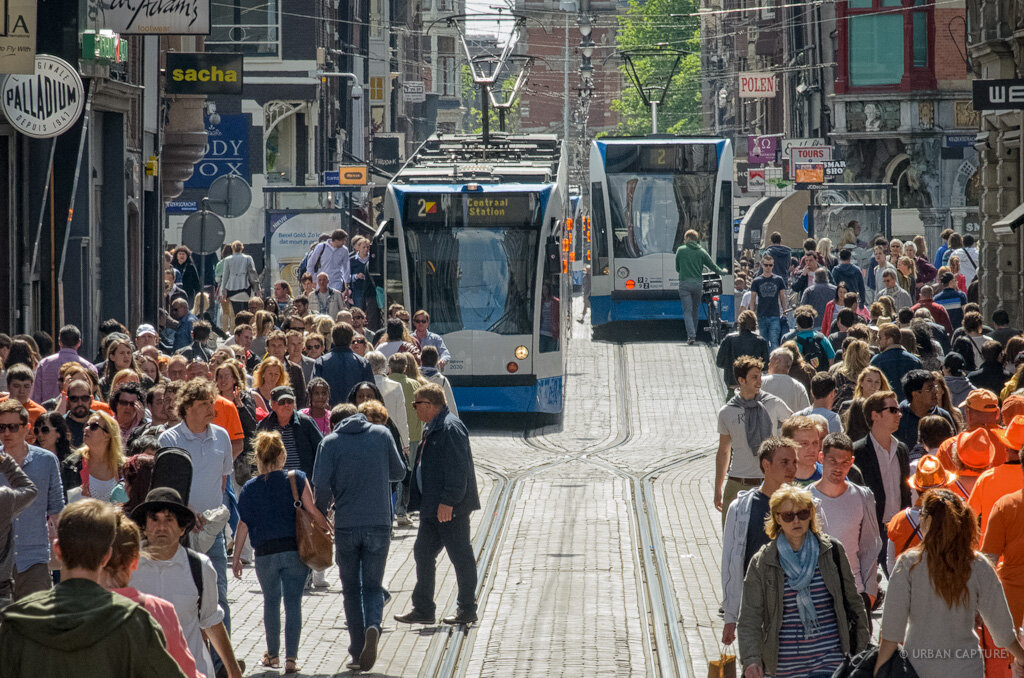
We need a form of transit that is permanent and that can inspire people to shift the way they move.
A Light Rail Transit system will provide a skeleton around which urban stations, suburban centres, rural towns and community hubs are built. The LRT skeleton will connect to existing Nova Scotia transit networks, creating the needed connections between them.
LRT sees these existing systems as crucial feeder systems to create a web of transit that will reach all Nova Scotians. This hybrid of LRT, feeder networks and active transportation is the vision we need to connect communities to each other and to the province as a whole.
LRT is a fixed, permanent investment. It creates a foundation to build on, and a basis for how all the other levels of transportation connect.
LRT has a strong public image and inspires people to change the way they travel.
A LRT skeleton would connect communities and neighborhoods by bridging the existing transit systems.
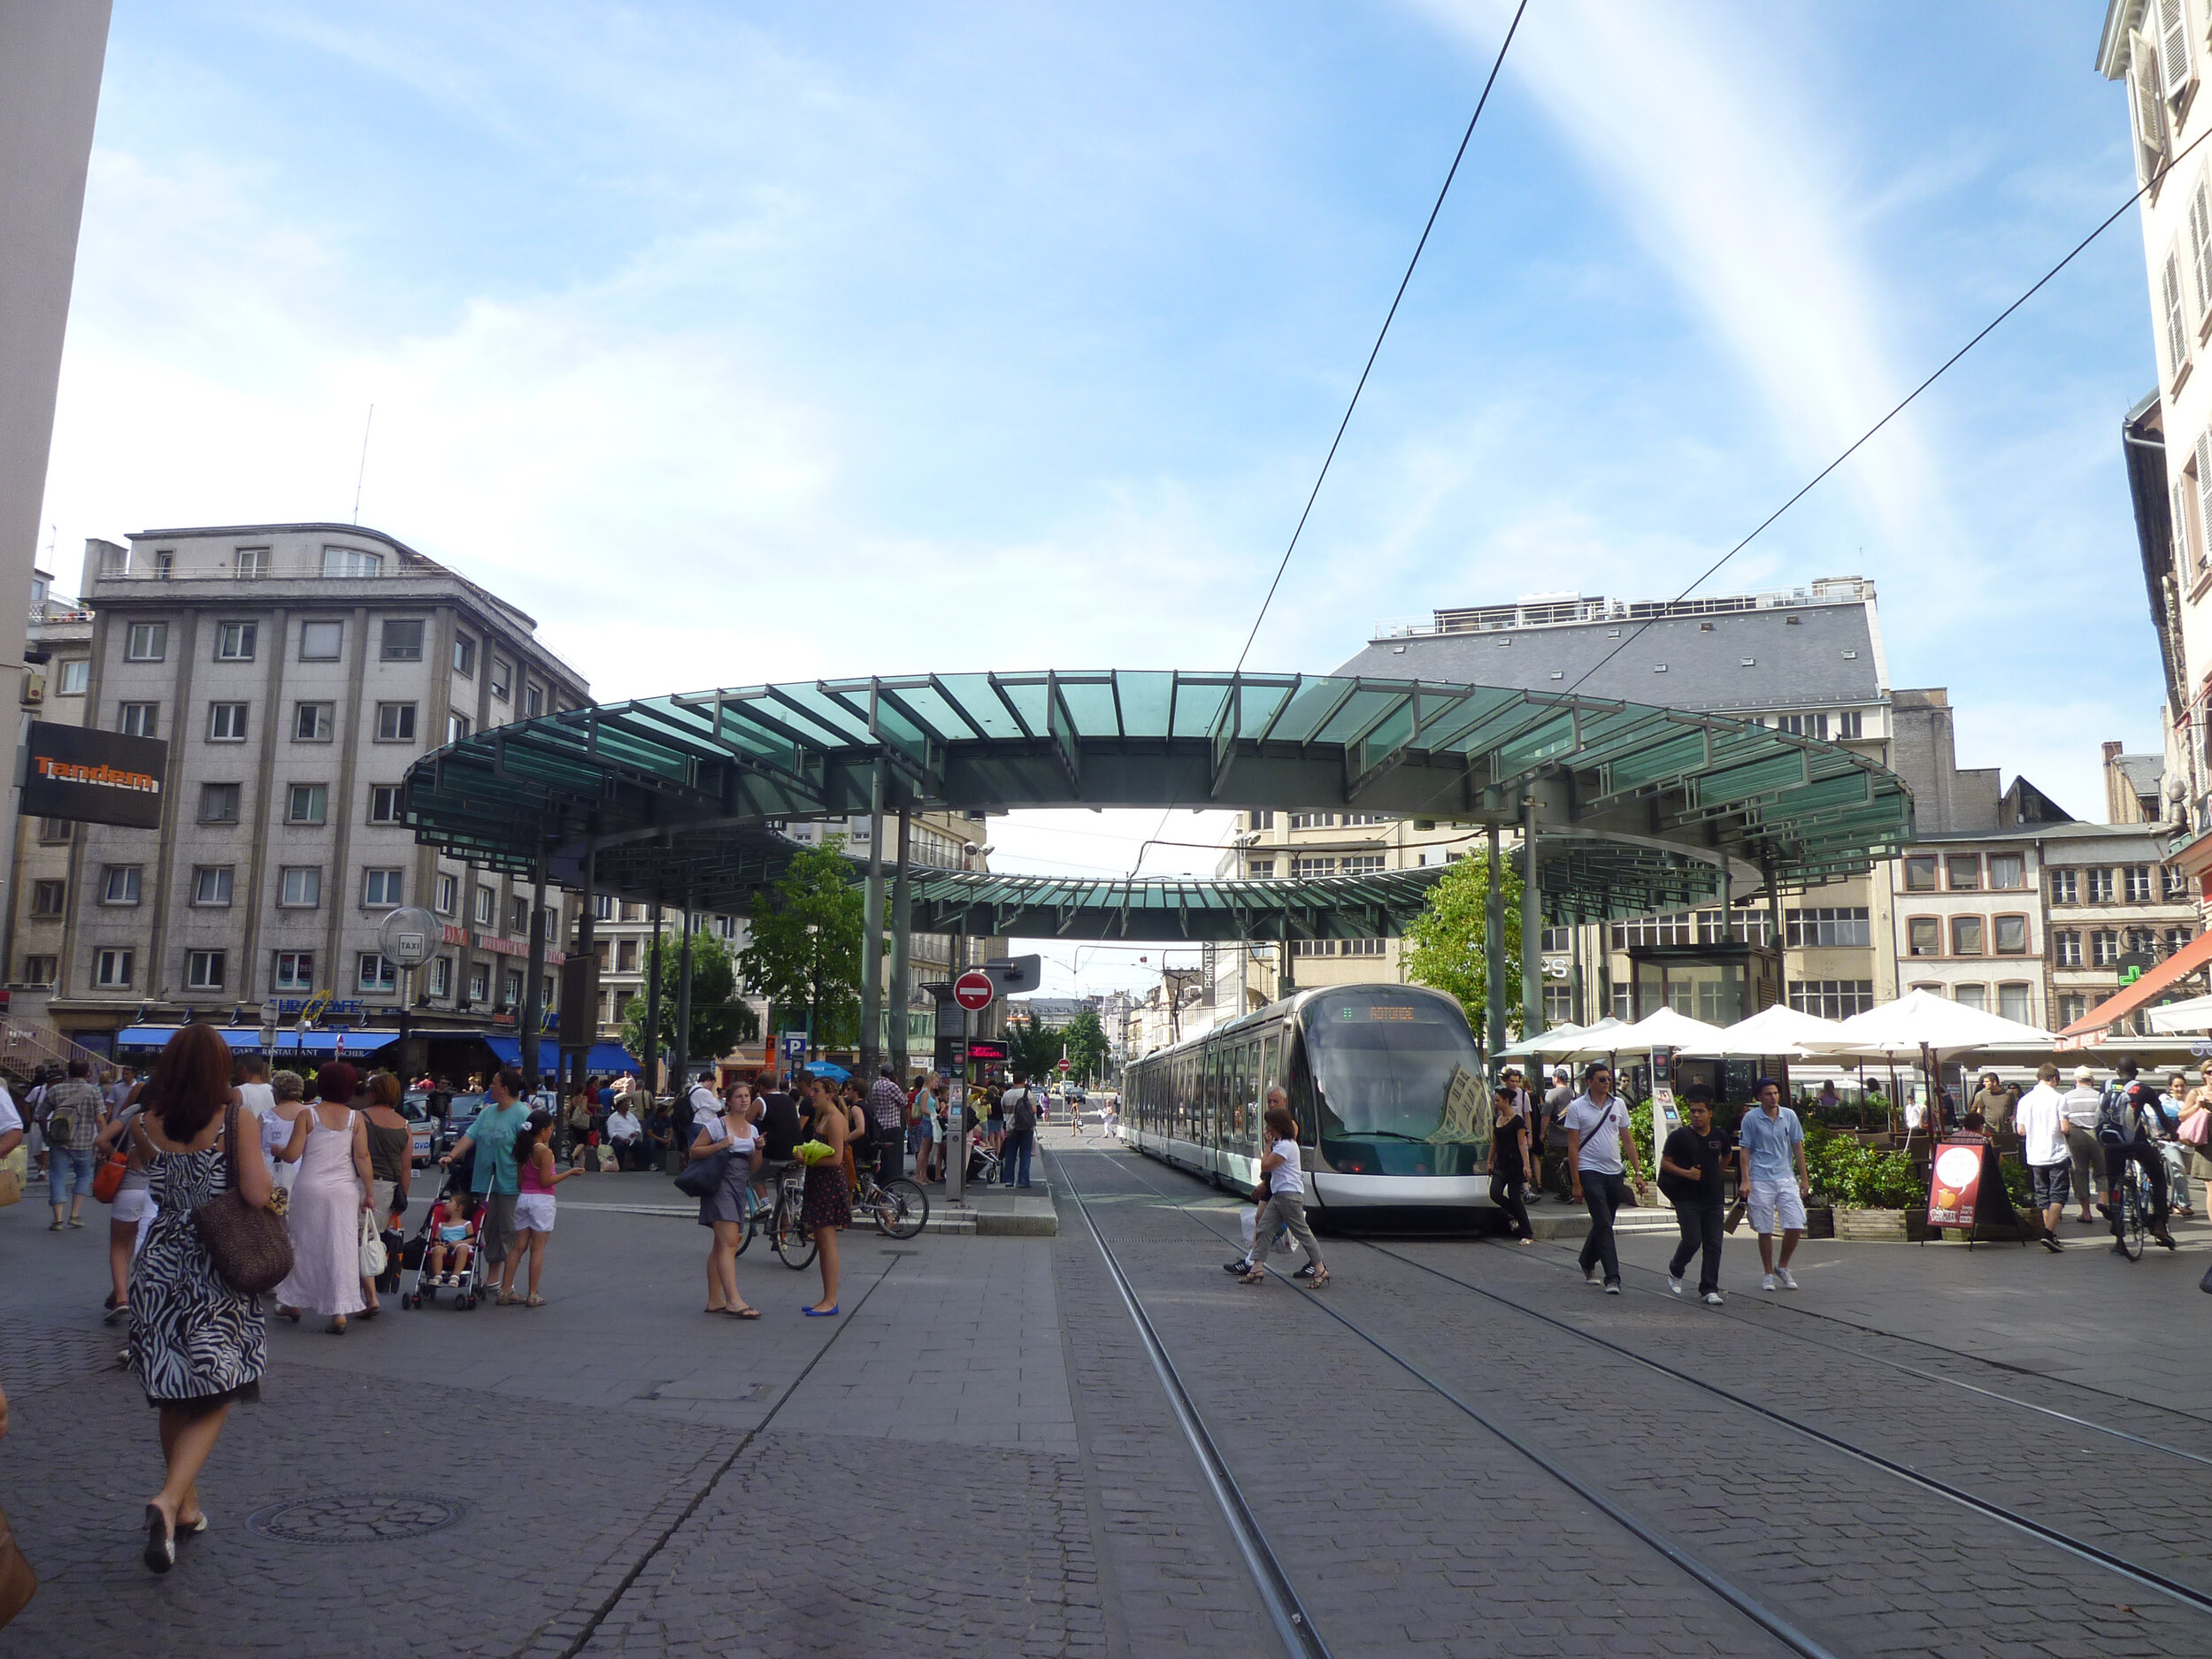
Ensures accessibility for riders at all levels of mobility due to low floor level boarding with multiple doors, so mobility devices, bicycles and strollers, can easily roll on and off.
More easily connects to active transportation. During design and construction the LRT system can integrate parallel active transit systems.
Guides growth and development by creating a map for which it can happen. Brining people to the surrounding areas around urban centers. Nova Scotians could easily live, work and play beyond the HRM.
Attracts long term development and investment.
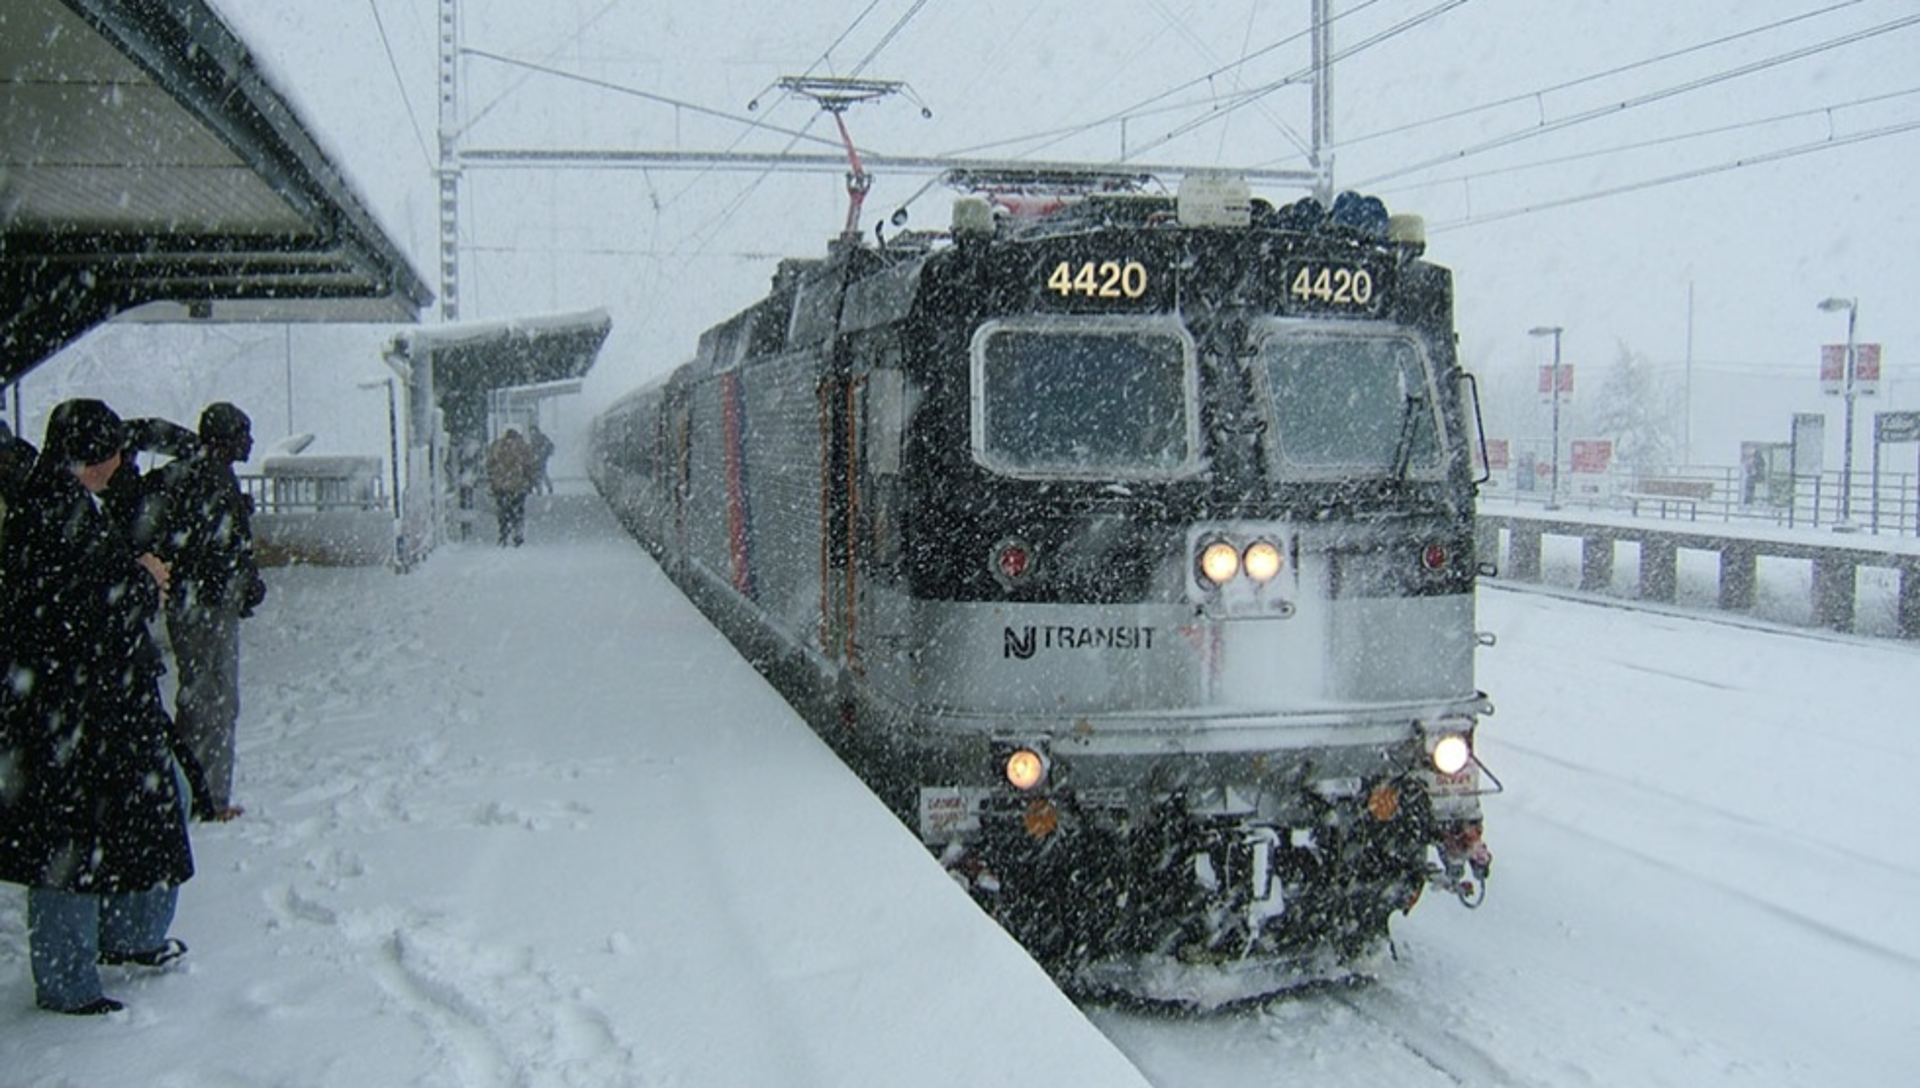
Provides reliability and improved frequency as it is not limited by traffic, construction and weather.
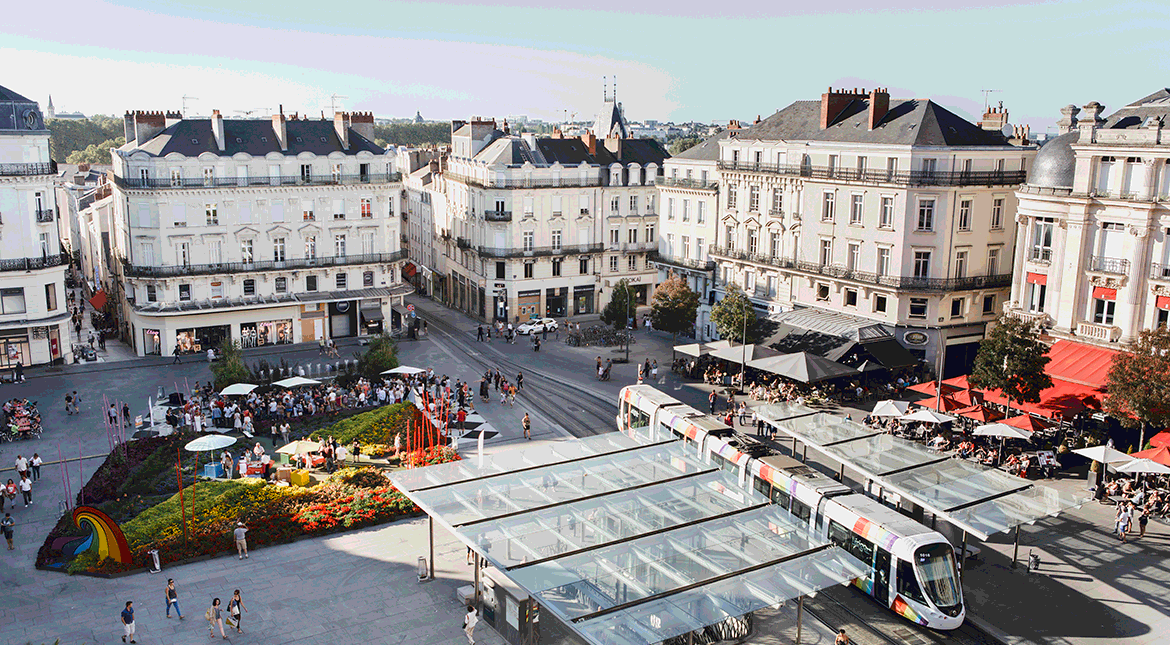
LRT is clean and green with no emissions from the vehicle, which reduces air pollution and contributes to cleaner air. LRT will encourage and supporting NS transition to clean energy.
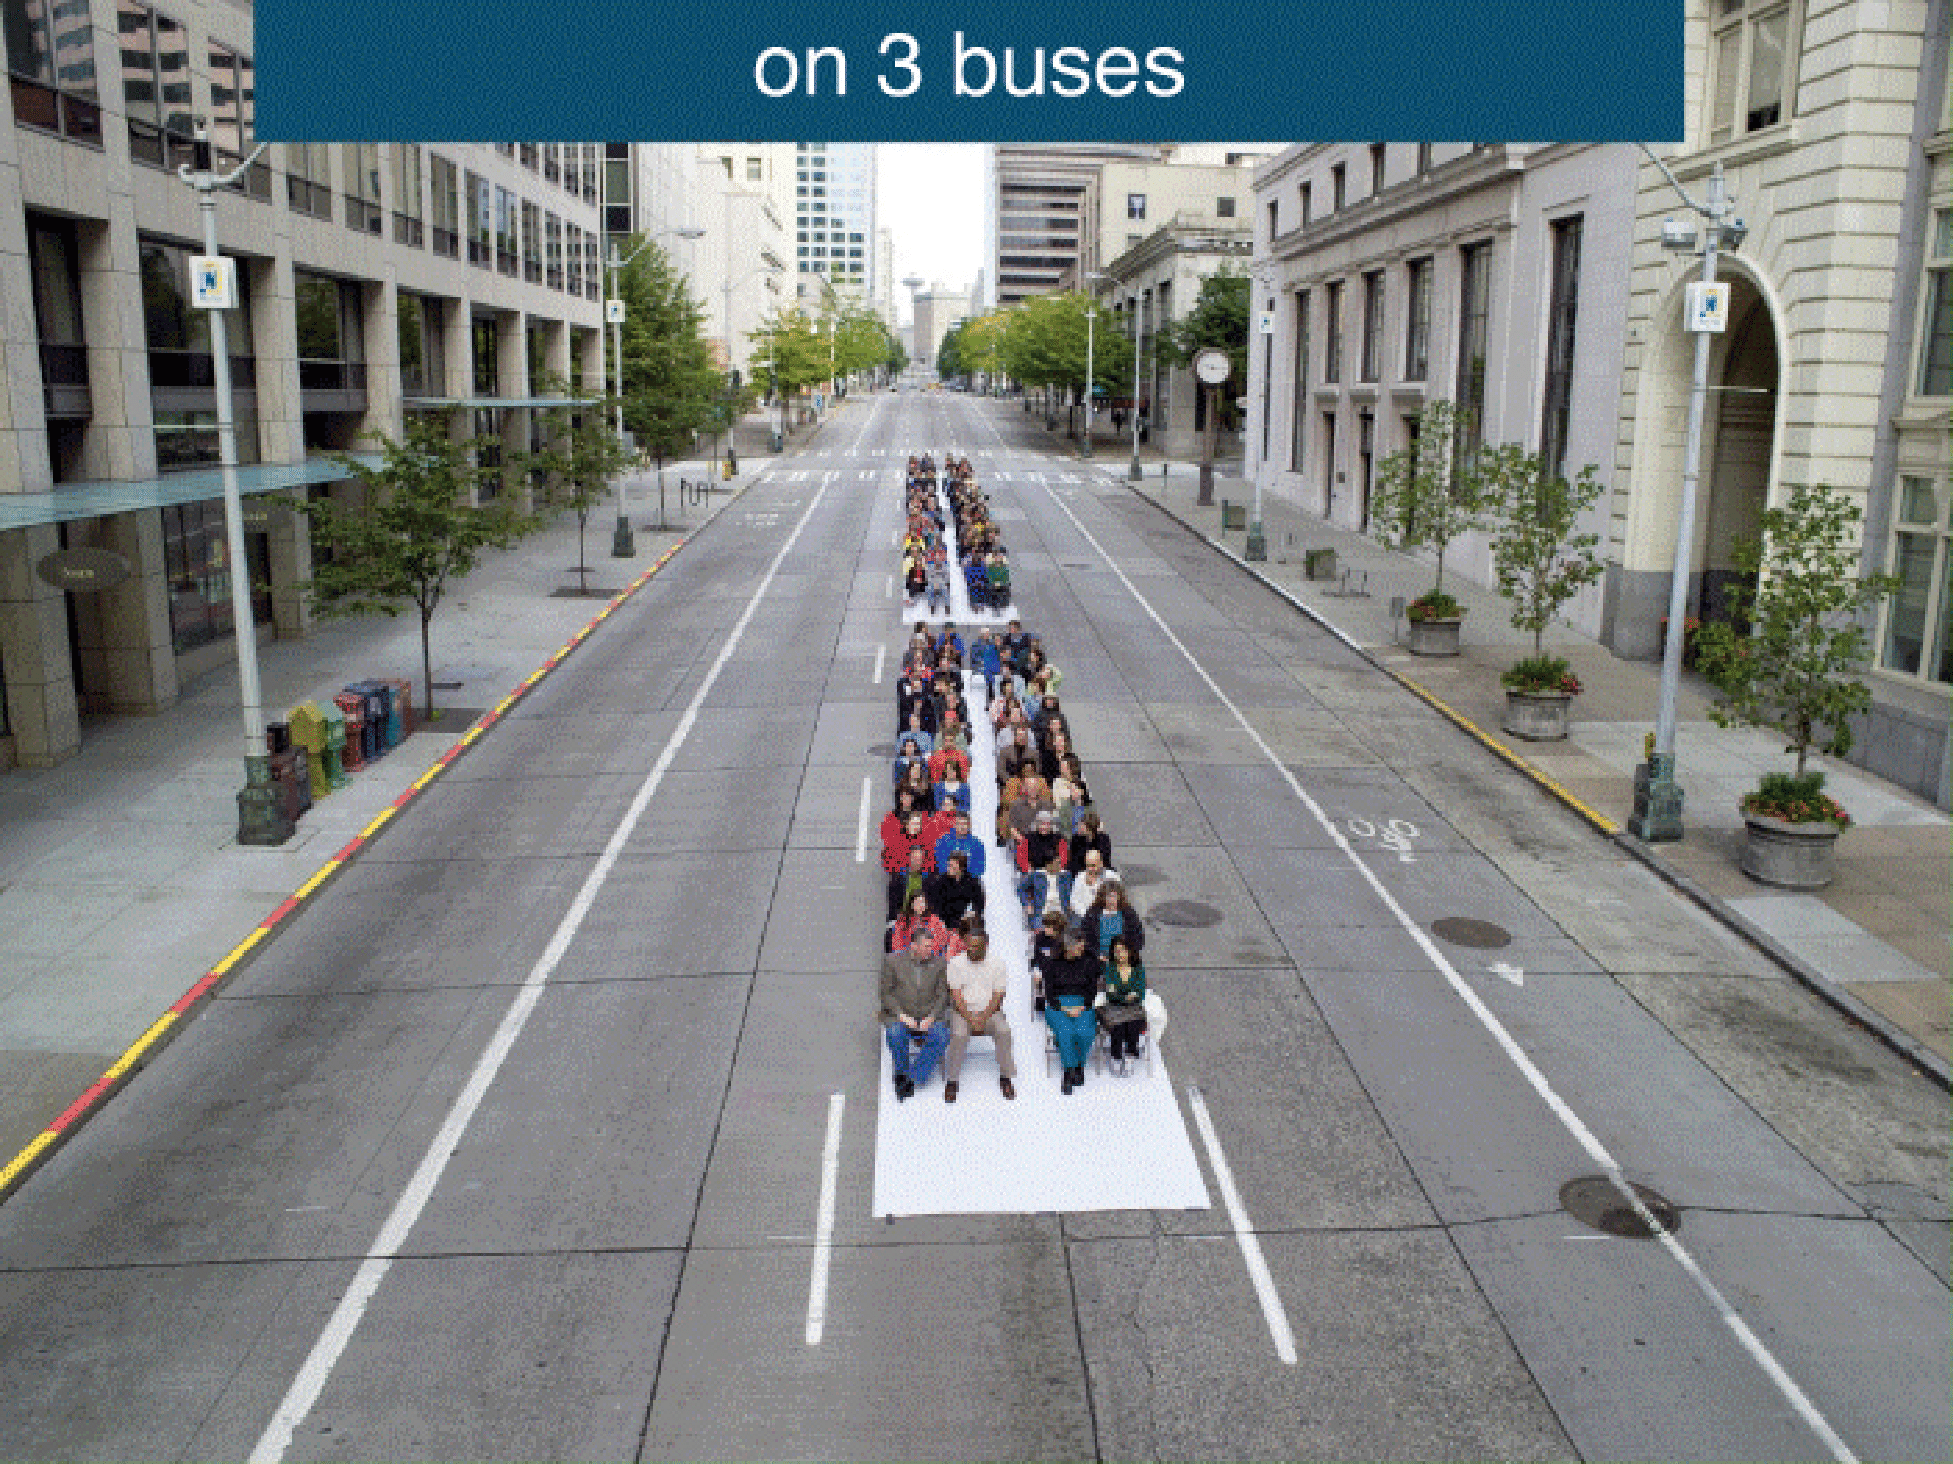
LRT moves more people with fewer vehicles. The full standing capacity of a standard and articulated (or accordion-like) buses is approximately 75-115 passengers, compared with up to 400 passengers on a two-car LRT.
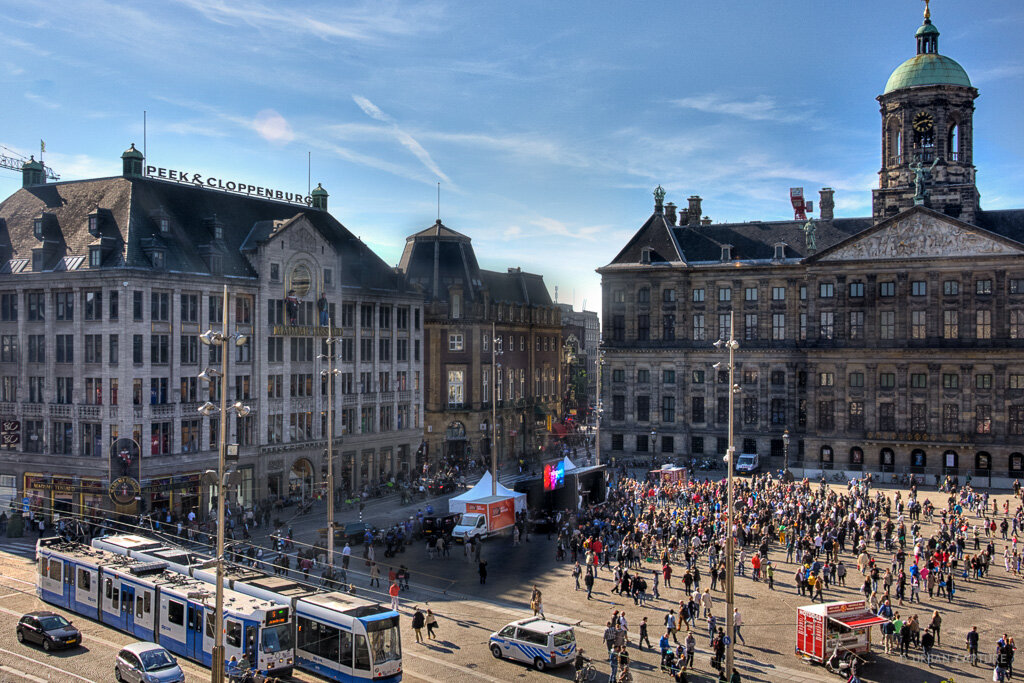
While streets were once a place where we stopped to chat with neighbour and children played, they are now the exclusive domain of cars.
Traffic and road capacity are not the result of growth. They are the product of choices that have been made to shape our communities around cars.
We have the ability to make different choices, starting with Leading with Transit.
Streets should be oriented towards people. The way that we make more room for people is not just taking away parking and increasing sidewalks and bike lanes.
We have to reduce the number of cars on the street itself. Transit stations become real places full of activity, as apposed to a sign on the street. Using right-of-ways. This allows for a major shift to people focused streets, increased social use, market place, streets as public spaces.


Armstrong LJ. 1994. Contribution of heavy metals to storm water from automotivedisc brake pad wear. Santa Clara Valley Nonpoint Source Pollution Control Program.
American Public Transportation Association (2020). Public transportation facts. [Web page]. Retrieved from https://www.apta.com/news-publications/public-transportation-facts/
Evergreen Transit Oriented Development https://www.evergreen.ca/downloads/pdfs/2018/How_to_create_vibrant_transit_supportive_communities_Evergreen_Pembina.pdf
Nova Scotia Finance Statistics (2018) https://novascotia.ca/finance/statistics/news.asp?id=15535
Government of Canada (2019). Provincial and territorial energy profiles – Nova Scotia. Canada Energy Regulator [Web page]. Retrieved from https://www.cer-rec.gc.ca/nrg/ntgrtd/mrkt/nrgsstmprfls/ns-eng.html
Government of Canada (2020a). Greenhouse gas emissions [Web page]. Retrieved from https://www.canada.ca/en/environment-climate-change/services/environmental-indicators/greenhouse-gas-emissions.html
Government of Canada. (2020b). Health. Statistics Canada [Web page]. Retrieved from https://www150.statcan.gc.ca/n1/en/subjects/Health
Government of Nova Scotia. (2017). Taking action. Nova Scotia: Canada [Web page]. Retrieved from https://novascotia.ca/nse/air/action.asp
Schmitt, A. (2019, January 30). Congestion pricing, often attached as inequitable, is actually the cure for inequitable transportation. Streets Blog USA [Web article]. Retrieved from https://usa.streetsblog.org/2019/01/30/congestion-pricing-often-attacked-as-inequitable-is-actually-the-cure-for-inequitable-transportation/
State of Delaware, Division of Waste and Hazardous Substances. Retrieved from http://www.dnrec.delaware.gov/dwhs/info/Pages/OzonePublicTrans.aspx
Statistics Canada. (2020a). Asthma, by age group [Web page]. Retrieved from https://www150.statcan.gc.ca/t1/tbl1/en/tv.action?pid=1310009608&pickMembers[0]=1.4&pickMembers[1]=3.1
Statistics Canada. (2020b). Table 13-10-0096-20 Body mass index, overweight or obese, self-reported, adult, age groups (18 years and older) [Web page]. Retrieved from https://www150.statcan.gc.ca/t1/tbl1/en/tv.action?pid=1310009620&pickMembers[0]=1.4&pickMembers[1]=3.1
Statistics Canada. (2020c). Table 13-10-0096-04 Perceived life stress, by age group [Web page]. https://www150.statcan.gc.ca/t1/tbl1/en/tv.action?pid=1310009604
United Way Halifax (led by Boyer, T., Hutchinson, P., Johnson, M., & Wilcox, J.). (2018). Building poverty solutions: Ideas for action: A community report. Halifax Regional Municipality [Municipal report]. Retrieved from https://www.halifax.ca/sites/default/files/documents/city-hall/standing-committees/180326cped1031.pdf
Varin, M., Baker, M., Palladino, E., & Lary, T. (2019). Canadian Chronic Disease Indicators, 2019 – Updating the data and taking into account mental health. At-a-glance [Web article]. Retrieved from https://www.canada.ca/content/dam/phac-aspc/documents/services/reports-publications/health-promotion-chronic-disease-prevention-canada-research-policy-practice/vol-39-no-10-2019/EN_2_Varin.pdf